My recent encounter with binary RLE image
Recently I was working with a specific PLC screen that allowed you to poll what’s currently being displayed as an image, and I had to learn from undocumented code how this thing worked! ChatGPT was actually pretty instrumental in helping me understand this code because most of the functions were cryptically named, and all the parameter names were usually one letter! ONE LETTER!
Once I understood a bit more about what Run Length Encoding was and what a simple run length encoding looked like, I had to learn how this PLC encoded the images. And boy howdy did I have to learn a lot the hard way.
I’m pretty thankful that I’ve had some previous exposure to working with binary data from working in industrial automation because it did expose me to concepts like endianness, bytes, binary “words”, combining bytes to make a single number, etc. Typically, people transmit image data as binary blobs, and this PLC was no different.
This binary blob was retrieved via HTTP, which most people should be familiar with. At the beginning though my main questions were like “But how do you “construct” an image from an HTTP response? And WHERE do you put this image?”
Allow me to share my findings!
What is RLE
RLE stands for Run Length Encoding and is a simple way to compress data. A “run” is considered a length of data that doesn’t change.
Take for example the string: WWWBBBWWW. There are 3 W’s, followed by 3 B’s, followed by another set of 3 W’s. We could compress the “runs” as the shorter string: 3W3B3W.
Here’s a simple example written in JavaScript to encode a string:
const rawStr = "WWWBBBWWW";

function runLengthEncode(input) {
    if (input.length === 0) {
        return input;
    }

    let output = '';
    let count = 1;

    for (let i = 1; i <= input.length; i++) {
        if (input[i] === input[i - 1]) {
            count++;
        } else {
            output += count + input[i - 1];
            count = 1;
        }
    }

    return output;
}

runLengthEncode(rawStr); // 3W3B3W
High level overview
So here is the high level overview of how I learned to display an image from binary data:
Images are typically thought of as a set of pixels. Each pixel has a combination of color values that make up its final color, typically as a mix of Red/Green/Blue.
For this article, we will have a hard-coded table of colors to choose from, though in the real world you may have to fetch the color table from another HTTP route or refer to a manual for what color codes are supported by the HMI.
From the binary blob, we reconstruct each individual pixel along with its color values. We will use the Canvas HTML element as the thing that will hold and display these pixels.

Displaying pixels on a Canvas
The Canvas HTML element exposes a very important API, aptly named the Canvas API and you can find more information on it here:
https://developer.mozilla.org/en-US/docs/Web/API/Canvas_API
I’ll skip you the reading and focus on a few important classes:
- CanvasRenderingContext2D: You retrieve this object from the Canvas HTML element and is used to modify the “image” currently being displayed on the Canvas.
- ImageData: This class exposes a 1 dimensional array that represents pixels and their colors. Be default the pixels are represented by a group of 4 array elements, each representing an RGBA value. An example of a single red pixel is:
[255, 0, 0, 255] - Uint8Array: This class isn’t exclusive to the
Canvas API, but we do use it to access all the bytes that make up the binary blog.
Here is a really simple example that draws a 25 x 25 pixel square on a canvas:
const canvas = document.getElementById("canvas");
const context = canvas.getContext('2d');

const newImage = context.createImageData(25, 25); // 25px square

for (let pixelIndex = 0; pixelIndex < newImage.data.length; pixelIndex += 4) {
    newImage.data[pixelIndex] = 255; // Red
    newImage.data[pixelIndex + 1] = 0; // Green
    newImage.data[pixelIndex + 2] = 0; // Blue
    newImage.data[pixelIndex + 3] = 255; // Alpha
}

context.putImageData(newImage, 0, 0);
Here was the output:

Colors from Run Length Encoded binary
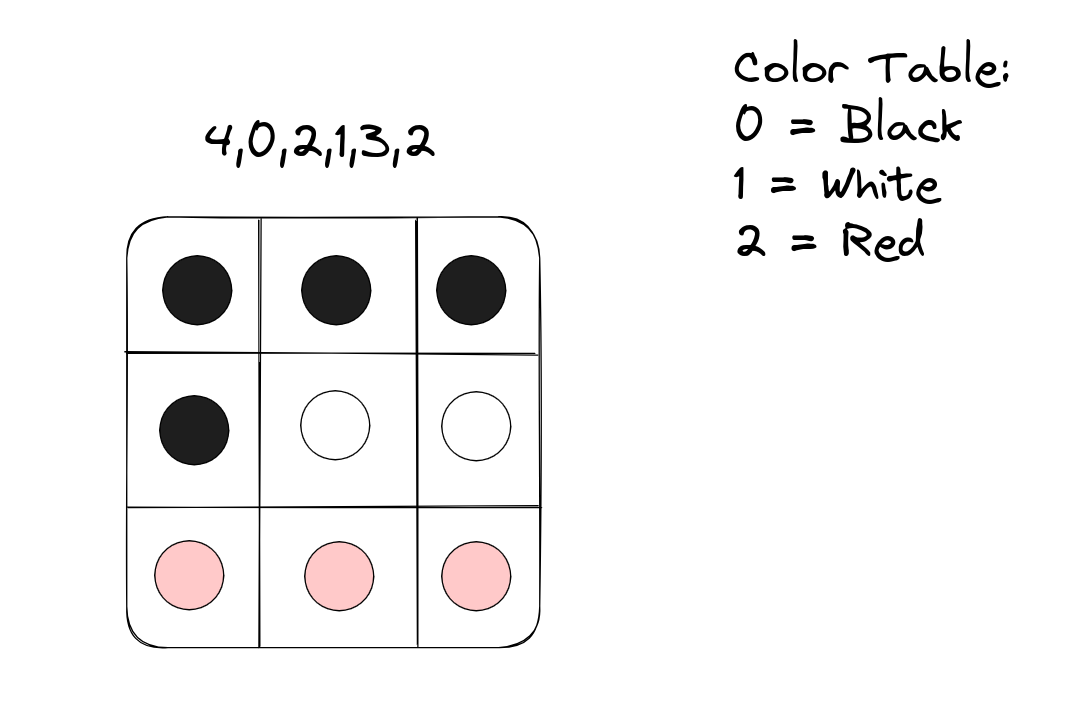
Next, you have to decode the binary information from the HTTP response. In our simple example, our “unit” of information was a single character, which we then encoded as pairs of 2 characters: The first character being the length of the run, and the next character being the number of times the letter appeared.
Let’s pretend you have this as the color table:
const colorTable = {
    1: [255, 0, 0, 255], // Red
    2: [0, 255, 0, 255], // Blue
    3: [0, 0, 255, 255], // Green
}
When working with binary, we typically work with groups of 8 bits, also known as bytes! So the binary string: 0000001000000001 would turn into the array: [00000010, 00000001].
When we turn that binary into decimal numbers we get: [2, 1].
The number 2 in this case would represent the number of pixels with the same color. The number 1 would represent the “color” being drawn, in this case it would be red. This is where we would reference a color table to get the RGBA values of the color.
Here is some code the decodes the binary string:
function binaryToBytes(binary) {
    let binaryString = binary.toString(2).padStart(16, "0");

    let bytes = [];
    for (let i = 0; i < binaryString.length; i += 8) {
        const binaryStr = binaryString.slice(i, i + 8);

        bytes.push(parseInt(binaryStr, 2));
    }

    return bytes;
}

let binary = 0b00000010_00000001;
let bytes = binaryToBytes(binary);

console.log(bytes); // Outputs: [2, 1]
Note, not all PLC HMIs give you a hard-coded color table. In fact, they can also embed color information as 16 bit unsigned integers in RGB555 format. More information can be found here:
https://learn.microsoft.com/en-us/windows/win32/directshow/working-with-16-bit-rgb
Putting it all together
Now that we’ve explored each of the components that make up a Run Length Encoded binary blob and know how to put pixels onto a canvas, let’s see the whole thing in action!
Here is the HTML:
<!DOCTYPE html>
<html>

  <body>
      <canvas id='canvas'></canvas>
      <script src="script.js" type="module"></script>
  </body>

</html>
Here are the JS files:
// script.js
import { binaryImage, colorTable } from "./image.js";

const canvas = document.getElementById("canvas");
const context = canvas.getContext("2d");

const newImage = context.createImageData(300, 300); // 300 x 300 square

// Apply each "run" (length/color combination) to each individual pixel
let pixelDataIndex = 0;
for (let byteIndex = 0; byteIndex < binaryImage.length; byteIndex += 2) {
    const runLength = binaryImage[byteIndex];
    const color = colorTable[binaryImage[byteIndex + 1]];

    for (let i = 0; i < runLength; i++) {
        // Remember, ImageData.data interprets a pixel as a group of 4 elements
        // RGBA
        newImage.data[pixelDataIndex] = color.r;
        newImage.data[pixelDataIndex + 1] = color.g;
        newImage.data[pixelDataIndex + 2] = color.b;
        newImage.data[pixelDataIndex + 3] = 255;

        pixelDataIndex += 4;
    }
}

// Finally, apply the image to the canvas
context.putImageData(newImage, 0, 0);
// image.js
export const colorTable = {
0: { r: 0, g: 0, b: 0 }, // Black
1: { r: 165, g: 42, b: 42 }, // Brown
2: { r: 255, g: 0, b: 0 }, // Red
3: { r: 255, g: 165, b: 0 }, // Orange
4: { r: 255, g: 255, b: 0 }, // Yellow
5: { r: 0, g: 255, b: 0 }, // Green
6: { r: 0, g: 0, b: 255 }, // Blue
7: { r: 128, g: 0, b: 128 }, // Purple
};
// A helper function to draw rows of a color
function makeRows(rows, runLength, color) {
let row = [];
for(let i = 0; i < rows; i++) {
row.push(runLength);
row.push(color);
}
return row;
}
let rlePrideFlagBytes = [
...makeRows(10, 255, 0), // Black
...makeRows(10, 255, 0), // Black
...makeRows(10, 255, 1), // Brown
...makeRows(10, 255, 1), // Brown
...makeRows(10, 255, 2), // Red
...makeRows(10, 255, 2), // Red
...makeRows(10, 255, 3), // Orange
...makeRows(10, 255, 3), // Orange
...makeRows(10, 255, 4), // Yellow
...makeRows(10, 255, 4), // Yellow
...makeRows(10, 255, 5), // Green
...makeRows(10, 255, 5), // Green
...makeRows(10, 255, 6), // Blue
...makeRows(10, 255, 6), // Blue
...makeRows(10, 255, 7), // Purple
...makeRows(10, 255, 7), // Purple
];
export const binaryImage = new Uint8Array(rlePrideFlagBytes);And here is the generated image! <3
